
 When we think of the science of analytics, we consider it as a part of mathematics. And math is a set of instructions, even more than science. For instance, it doesn’t matter how you set up your equation, 3 + 3 + 5 = 11. Set differently, the equation would still be: 5 + 3 + 3 = 11. And: 3 + 5 + 3 = 11. Science, on the other hand, requires replicating an experiment with exacting standards – keeping track of the ingredients, the steps, the temperature, etc. That way, repeating the experiment should yield the same result, but altering one ingredient or step may bring a different result. That’s experimentation. Analytics as a discipline tries to emulate mathematics and science, but throws programming into the mix. Like math, we look to build an equation as an elegant way to line up our data. Like science, we conduct experiments using programming in order to see what happens when we mix different data together. And mixing the data together takes programming. However, analytics is also an art, like interpreting poetry. Let’s examine that idea. Analytics brings together several different disciplines:
Even as a science, though, this discipline does involve art. Beyond all the database knowledge, statistical methods, and machine learning, there is a need for any good donor modeler and data miner to be inspired by the Muses. Like the symbolism of poetry, data and data patterns tell the story of human behavior, and maybe even human sentiment. Take a look at the illustration below. It compares cost per dollar raised among 5 colleges/universities that are in the same market. The whisker and box plot shows a five-year spread for cost per dollar raised for each institution. What do you see? 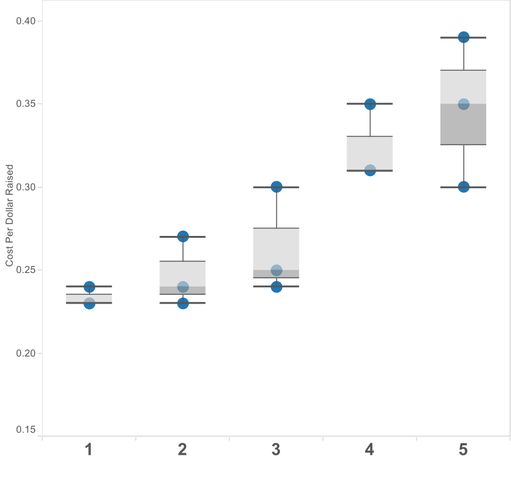 The first thing that your audience would see is that University 1 has a very low cost per dollar raised. We can send a hearty congratulations to that development office.
What else do you see? Is there any poetic symbolism in this chart? Let me tell you what I see. University 5 shows a broader spread than the other universities, and, indeed, shows higher cost per dollar raised amounts than its peers. Does this mean that the shop is in trouble? I question why the spread is so high. Also, why does University 1 show such a small range? My first impulse is to check whether University 5 has seen a change of leadership, and if University 1 has not. Once staff are settled in, they tend to keep patterns, including how much money they raise. This particular line of inquiry is the art part. It’s the same kind of curiosity that drives scientists, NASA expeditions, artists, and poets. Where inspiration comes from is a mixture of experience, imagination, and persistence. For instance, I needed experience with both shops that have stable staffs and shops that have changing staffs to wonder about staffing changes. So, when your boss says, “Can you just read this book on analytics and then start doing it?” mention that your boss wouldn’t fly in an airplane whose pilot has just read a book and has no flying practice. You, even as a quick study, will need time, coaching, practice, and data to practice with. If you’ve just taken your first class on analytics and are frustrated that you can’t figure out your next step, then cut yourself some slack. Remember that even with video games, you build skills from level 1 to level 3 and then beyond. You would be entirely overwhelmed and under equipped if you tried to start at level 10, so don’t be tempted to jump into factor analysis if you’re still mastering regression. Meanwhile, take your time while trying out new ideas, new skills, new ingredients, and new data. Go for quick wins, and fail fast and often so you can move on to the bigger wins. When you get frustrated, go for a walk to move the blood back through your brain. Ask your friends on the PROSPECT-DMM list for ideas (I certainly do). Finally, remember that you are practicing analytics; it’s not a one-time affair. And that’s the best part of this art. Questions or comments? Tweet us - @Staupell.
0 Comments
Leave a Reply. |
Keep Informed
|

Photos from jeffdjevdet, SMPAGWU